id
name
related bits
0
processing priority
3
site type
0 (generic, awaiting analysis)
review version
11
html import
20 (imported)
first seen date
2024-03-28 22:09:14
expired found date
-
created at
2024-06-21 11:11:15
updated at
2026-01-05 11:44:34
length
10
crc
35901
tld
86
nm parts
0
nm random digits
0
nm rare letters
0
is subdomain of id
-
previous id
0
replaced with id
0
related id
-
dns primary id
dns alternative id
0
lifecycle status
0 (unclassified, or currently active)
deleted subdomains
0
page imported products
0
page imported random
0
page imported parking
0
count skipped due to recent timeouts on the same server IP
0
count content received but rejected due to 11-799
0
count dns errors
0
count cert errors
0
count timeouts
0
count http 429
0
count http 404
0
count http 403
0
count http 5xx
0
next operation date
-
server bits
—
server ip
-
mp import status
20
mp rejected date
-
mp saved date
-
mp size orig
23842
mp size raw text
15220
mp inner links count
0
mp inner links status
20 (imported)
title
description
image
site name
author
updated
2025-12-30 17:06:21
raw text
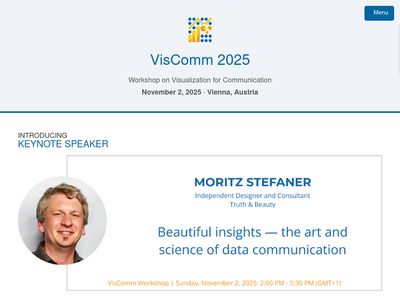
Visualization for Communication (VisComm) Logo by Allie Packard Program Important Dates Contribute Archive Close × Program Important Dates Contribute Archive INTRODUCING KEYNOTE SPEAKER Visualization for Communication (VisComm) WORKSHOP SUMMARY While the visualization field consists of researchers exploring how people perceive information and different data visualization tools and platforms, there is an even larger community of analysts, practitioners, and organizations who are creating data and information visualizations and communicating their work every day. The challenges these groups face in communicating their work are often distinct from the research taking place in the academic community. Most people experience visualization as communication and presentation. The New York Times and other publications regularly release interactive visuals depicting complex datasets including political topics, budgets, and sports. An independent community...
redirect type
0 (-)
block type
0 (no issues)
detected language
1 (English)
category id
Medicine [en] (226)
index version
2025123101
spam phrases
0
text nonlatin
0
text cyrillic
0
text characters
12289
text words
2106
text unique words
920
text lines
177
text sentences
97
text paragraphs
33
text words per sentence
21
text matched phrases
2
text matched dictionaries
7
links self subdomains
0
links other subdomains
links other domains
15 - alliepackard.me, ieeevis.org, osf.io, junctionpublishing.org, paulcparsons.com, policyviz.com
links spam adult
0
links spam random
0
links spam expired
0
links ext activities
1
links ext ecommerce
0
links ext finance
0
links ext crypto
0
links ext booking
0
links ext news
0
links ext leaks
0
links ext ugc
3
links ext klim
0
links ext generic
3
dol status
0
dol updated
2025-12-30 17:06:21
rss path
rss status
1 (priority 1 already searched, no matches found)
rss found date
-
rss size orig
0
rss items
0
rss spam phrases
0
rss detected language
0 (awaiting analysis)
inbefore feed id
-
inbefore status
0 (new)
sitemap path
sitemap status
1 (priority 1 already searched, no matches found)
sitemap review version
2
sitemap urls count
0
sitemap urls adult
0
sitemap filtered products
0
sitemap filtered videos
0
sitemap found date
-
sitemap process date
2024-07-01 15:40:28
sitemap first import date
-
sitemap last import date
-